Analytics & Reporting

Empower users to make the most of data

The Reporting Hub in Elements provides highly configurable reporting tools to track and analyse research activities, allowing you to see trends, track progress, and demonstrate compliance or engagement levels.

Visual Analytics 32

Demonstrate impact and gain actionable insights

Highly configurable reporting tools allow you to track and analyse all of your research activities, letting you see trends in research outputs, funding and citations; compare year-on-year figures and track progress against strategic objectives; and demonstrate compliance with government mandates and research impact or open access policies.

Elements Analytics 5

Reporting that works for you 

To put you in complete control, we provide a specialist SQL-based reporting database which supports direct SQL querying, integrated SSRS reporting and further analysis using the business intelligence tools of your choice.

Reports can be provided as formatted reports, visual dashboards or CSV extracts, making it easy to access your data in a way that works for you. User permissions can easily be managed to make sure different institutional roles have access to the data that is most useful to them. You can write your own custom report templates using SSRS, or our specialist team can work with you to create them on your behalf.

Stock or custom reports

Save time with our out-of-the-box dashboards and data extracts, available at the click of a button, or register custom reporting templates to your institution’s specific requirements. Stock reports include formatted CVs and biosketches, publication summaries, user profile completeness, ORCID identifier user, REF data quality, and more.


Elements Analytics 8 Elements Analytics 7 Elements Analytics 6
Dashboards

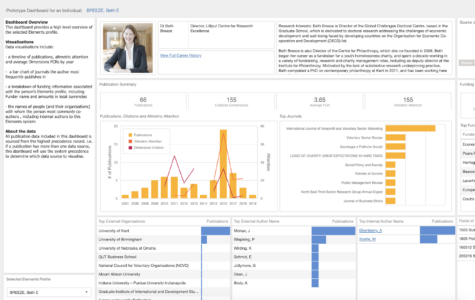
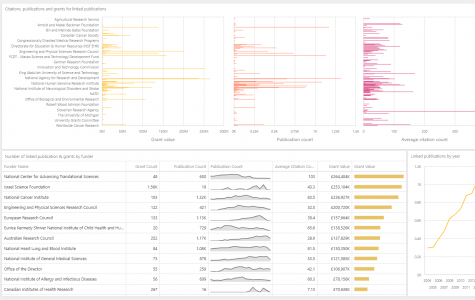
Interactive visualisations of aggregated data from across Elements

Formatted Reports

Produce reports in a variety of formats. Suitable for intermediate data volumes

Data Extracts

Extract large volumes of data in CSV format using SQL scripts

An Introduction to Elements 1

Reporting made easy

To put you in complete control of your reporting, Elements provides each of our clients with a specialist SQL-based Reporting Database which is continuously updated from the Elements operational database. This supports direct SQL querying but also allows you to analyse your Elements data using the business intelligence tool of your choice.

We also offer integrated SSRS reporting, empowering our clients to create their own custom reports which can be generated directly within the Elements UI. You can use our standard templates, write your own, or have our team of experts create custom templates for you. Our reporting functionality supports a wide range of data types and formatting options including dashboards, data extracts, spreadsheets, CVs, group activity reports or formatted lists of outputs and activities. You can even add visualisations such as charts, graphs, co-authorship or collaboration diagrams and maps. 
Reporting Database in action

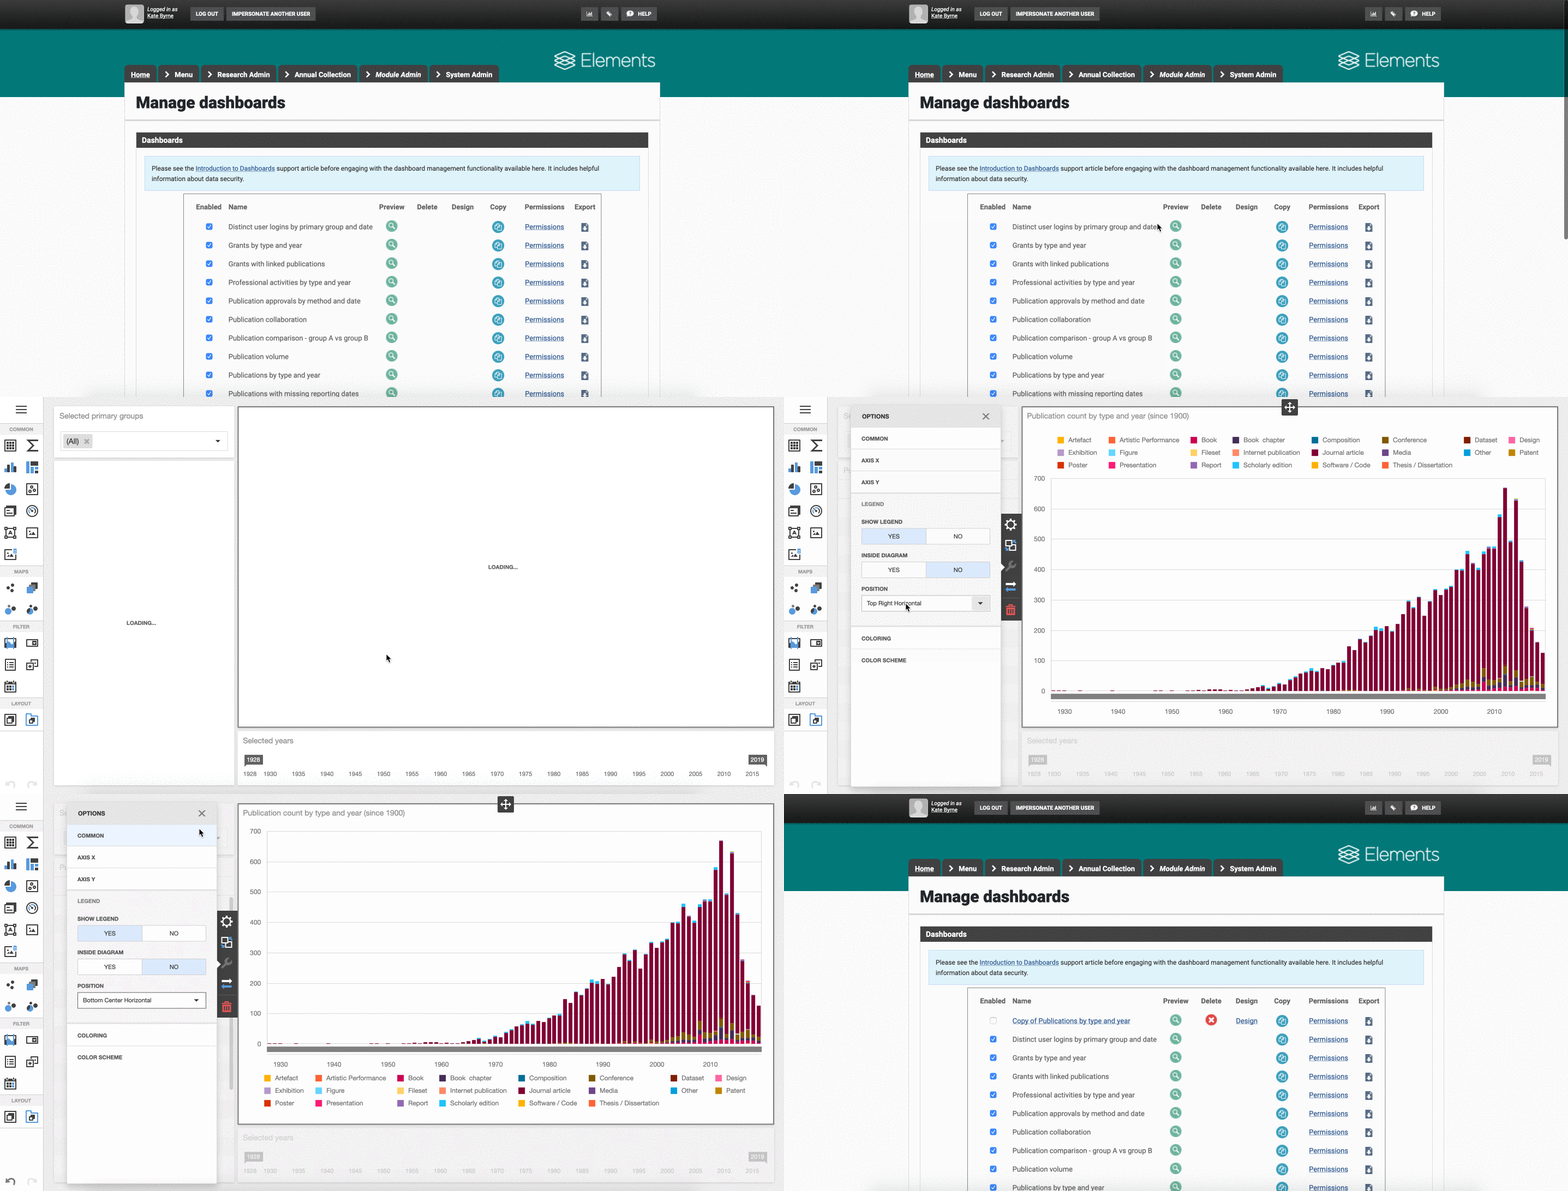
In the first video, the user is demonstrating how to edit a dashboard using the Elements dashboard designer.
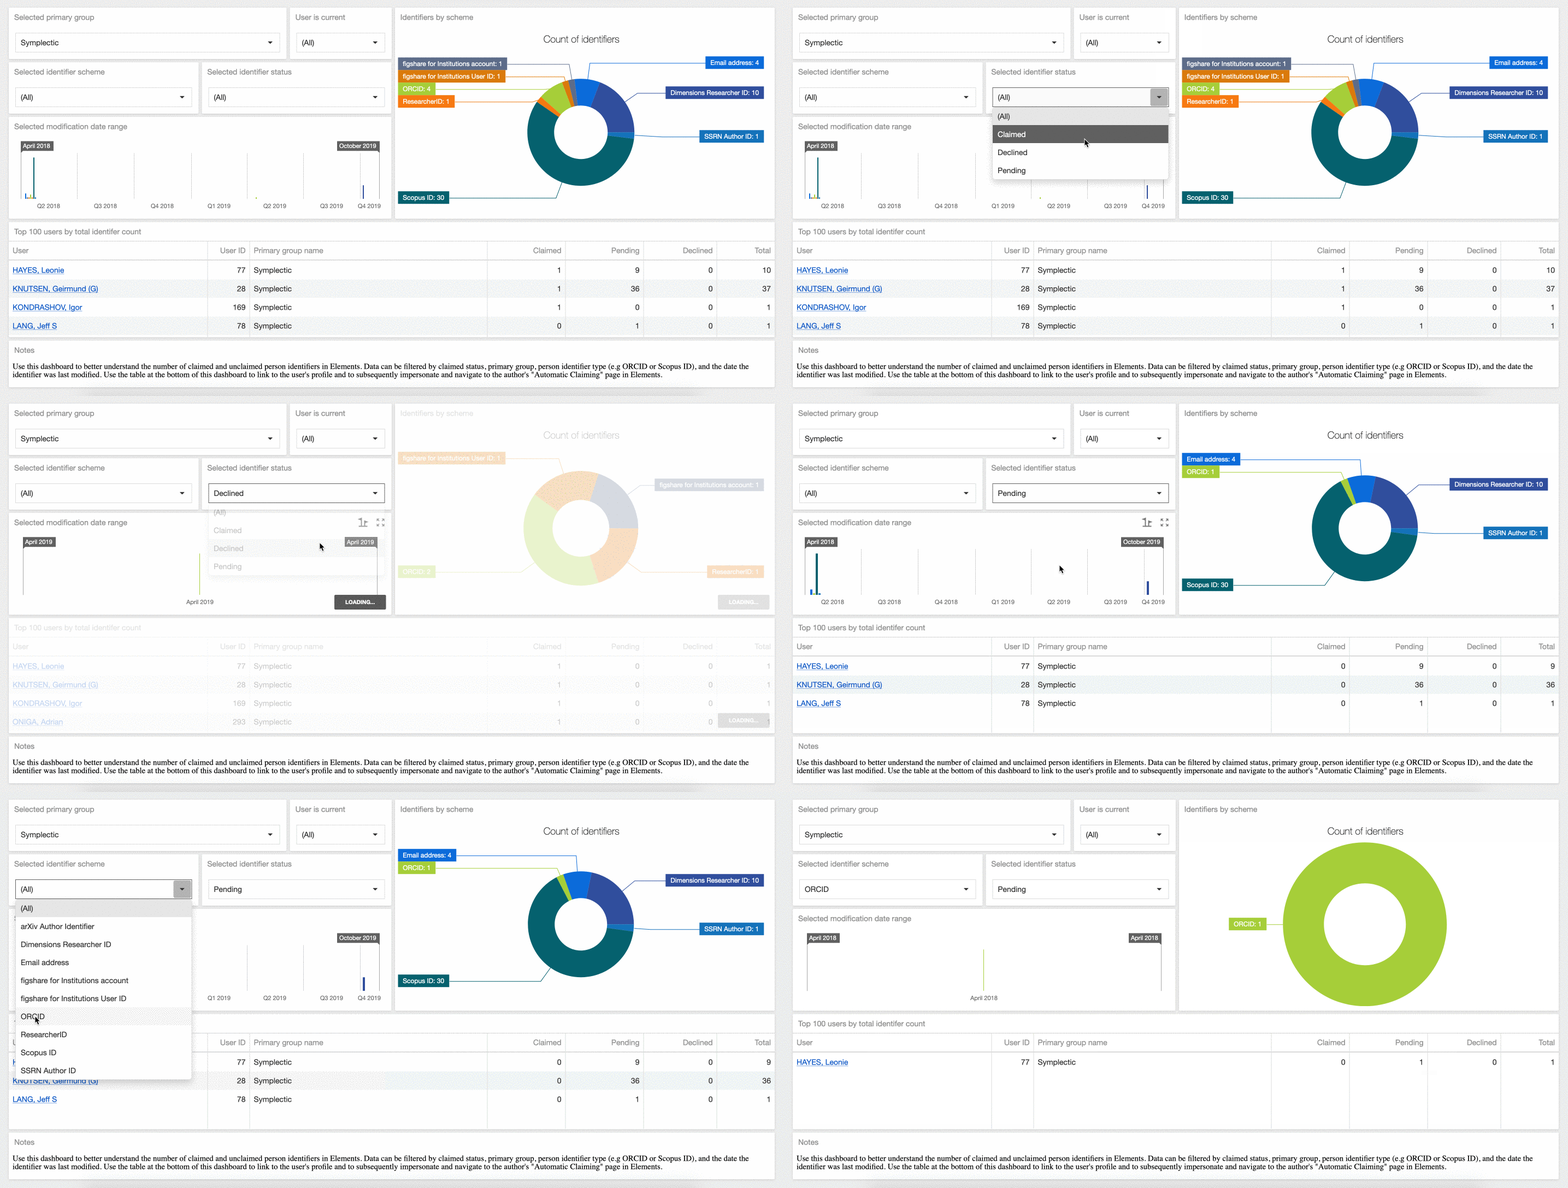
The second video highlights using the identifiers dashboard.


Visual Analytics 37     Visual Analytics 38


“Applying the Sustainable Development Goal framework to Elements facilitates both internal and external collaboration across education, research, and practice, advancing collective efforts to achieve this ambitious global agenda.”

Executive Fellow for Sustainability Initiatives, Carnegie Mellon University Libraries

It is critical to our state’s economy that we utilise every aspect of our knowledge
and innovation talent across the public and private sectors. We’re incredibly proud
of what we’ve created with OIEx − better connecting the experts and resources at our
state research universities to the industries that can utilise them to push their breakthrough ideas to fruition.

John Carey, Chanceller, Ohio Department of Higher Education

We wanted to create a single, multi-university resource that provides
enhanced visibility into expertise, equipment and research
support services and available IP.

Tim Cain, Ohio Innovation Exchange

This tool connects our scholarly and research expertise with audiences like media,
prospective graduate students, and academic collaborators, while simultaneously
helping faculty keep track of the very important work they do. It is a game-changer for U of T.

Associate Vice-President Research, University of Toronto

The deeply integrated environment we now have will greatly enhance
our ability to manage the range of repository activities and strengthen
our position in preparing for any future research assessment exercises.

Digital Development Manager, University of Sussex

It helps keep us organised and keeps everything in one place.

Peter Fisher, Worldwide Cancer Research

Researcher profiles and end-to-end funded research
project management all now take place in the one interface,
which has huge benefits to our researchers.

Liam Cleere, University College Dublin

The discovery module has provided a delightful and fantastic
searchable public interface to our to our faculty.

Paul Bergen, Tufts University

The rate of deposit has increased by 1000% within 12 months following the switch-on of
the publication prompt in Elements and discussion about the HEFCE Open Access policy.

Queen Mary University of London

Elements impressed us with its simplicity, flexibility and control
for individual faculty members, and great responsiveness with customer service.

Clarke Iakovakis, Oklahoma State University

I think the most important feature Symplectic Elements came with was interoperability
The fact that it had that flow through profiles to the repository was really, really valuable for us.

Research Advisor, La Trobe University